Display Settings
The Display section helps the administrator set the following settings.
| Country Settings. |
| Date Display Format. |
| Device Custom Properties. |
| Device Display Format. |
| Target Device Association Category. |
| Hide Sensitive Data. |
 If the changes in the display format are not reflected after saving, please re-login to CloudStream DM to see the changes.
| Item | Description |
|---|---|
| Country | You can change the default country. The default value of the country setting depends on the regional CloudStream DM server's system locale.
|
-
Login as an administrator.
-
Go to System and expand Server Settings.
- Click Display.
-
In the country drop-down menu, select a country of your choice.
-
Click [Save]. (Scroll down to see the save button)
The Date Display Format lets you change the Time Zone and the date formatting. These settings apply only to data within the application.
|
Item |
Description |
|---|---|
|
Reports Time Zone |
Select the time zone from the list. |
|
Date Display Format |
Select the date display format from the following:
|
-
Login as an administrator.
-
Go to System and expand Server Settings.
- Click Display.
-
In the Date Display Format, select a value for Reports Time Zone.
-
Select a value for Date Display Format.
-
Click [Save]. (Scroll down to see the save button)
The default value is determined based on the regional CloudStream DM server's system time zone.
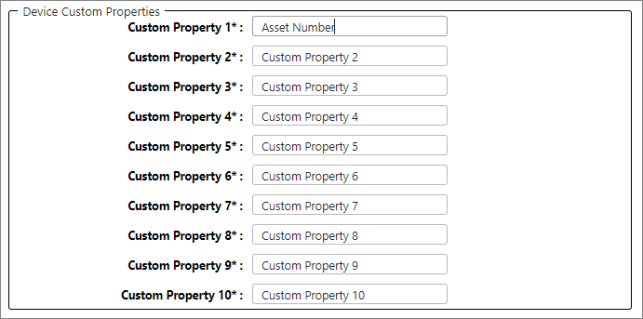
Device Custom Properties allows administrators to add custom property labels. You can set up to ten custom properties, which will be shown in the device's optional properties.
|
Item |
Description |
|---|---|
|
Custom Property 1-10 |
Set the custom property labels for all devices. |
-
Login as an administrator.
-
Go to System and expand Server Settings.
- Click Display.
-
In Device Custom Properties, select a custom property and overwrite with the name of your preference.
For example, Custom Property 1 value is "Asset Number".
-
Click [Save]. (Scroll down to see the save button)
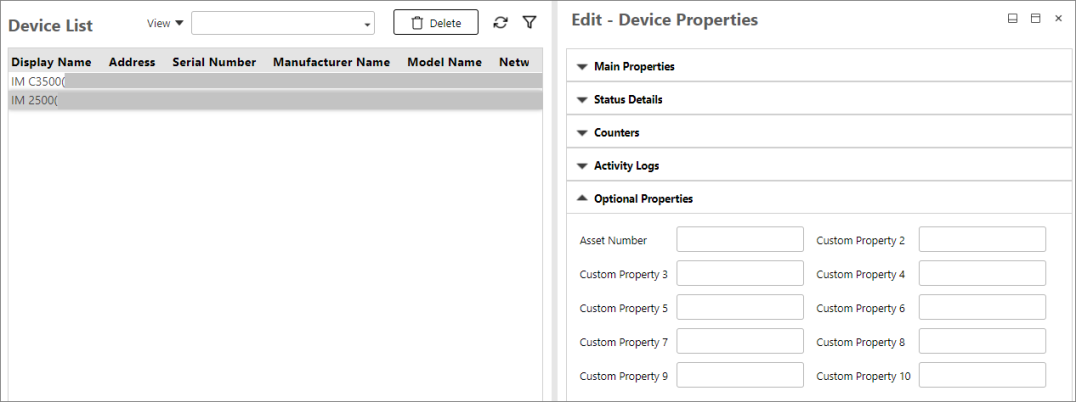
After saving, you can find the custom property changes in the device optional properties.
The Device Display Name Format allows you to format how devices are displayed in the Device List’s Display Name column. The setting lets you select multiple attributes, and the device's name will display according to the selected attributes.
For example, if you want the devices to display the Serial Number, then the IP Address, followed by the Model Name. To do so, right-click on the Device Display Name Format text box then you will see a list of device attributes. In this example, click Serial Number, then do the same steps to select the IP Address and the Model Name. The Device Display Format will then look like this: $[serial]$$[ip]$$[model]$
The default device display name is "model name (IP address of the device)" or '$[model]$$[ip]$' in the text box.
An Administrator can view the properties of a device within the Device List, and can manually enter a Display Name. In this case, the manual entry overrides the Device Display Name format described below
|
Item |
Description |
|---|---|
|
Device Display Name Format |
Specify the format of the device display name. The default device display name is "model name (IP address of the device)".
The items to be included in the display name can be entered manually or selected from the list of variables. To display the list of variables, right-click the text box.
|
Target Device Association Category
The Target Device Association Category allows you to select a certain device category such as “Host name”, “IP Address”, “Models”, and custom categories. The groups within the selected category will be displayed as target group options to create a Device Policy. To know more about device policy, please see Device Policies.
|
Item |
Description |
|---|---|
|
Target Device Association Category |
Select the category of the devices associated with the Device Policies (Configuration Policy, Firmware Policy, Embedded Policy). The groups will be displayed in ascending order the same as the Device List. The selected device category will also be used to set the Alert Policies. |
-
Login as an administrator.
-
Go to System and expand Server Settings.
- Click Display.
-
In the Target Device Association Category, select a category.
For example, select IP Address category.
-
Click [Save]. (Scroll down to see the save button)
After saving, the only category displayed in the Device Policy Target Group is "IP Address".
To hide sensitive data in the Print Activity dashboard, Scan Activity dashboard, and generated reports, follow the steps below.
-
Login as an administrator.
-
Go to System and expand Server Settings.
- Click Display.
-
In the Hide Sensitive Data, choose or more options:
Value
When Checked
When Unchecked
Don't Record Job Name for Print&Scan Activities
The print and scan jobs are recorded, but their job names are not saved in the CloudStream DM database, so the job names are not displayed in the dashboard and in the generated report.
If you decide to uncheck this setting, new jobs are recorded with their names and displayed in the dashboard and report.
However, the names of the jobs before them cannot be displayed because they were not saved.
The print and scan jobs are recorded, and their names are saved in the CloudStream DM database. You can find the job names displayed in the print activity and scan activity dashboards and in the generated report.
If you decide to check this setting, new jobs are recorded, but their names are not saved.
Jobs whose names are saved in the database will still be displayed, while the new job names will not be saved and, therefore, cannot be displayed.
Don't Record User Name for Print&Scan Activities
When a print and scan job is completed, the user name is not saved in the database.
As a result, the dashboards and reports that contain this information will not be able to display the information.
In Dashboards, the User Name column will display 'Unknown'.
In Reports, the User ID and User Name columns will display 'Unknown'.
The user name is saved in the database and displayed in corresponding fields in both dashboards and reports.
-
Click [Save]. (Scroll down to see the save button)