Print Usage Analysis Reports
Use a report template in the Print Usage Analysis Reports category to create a report of the total print usage based on various criteria.
 To create reports in this category, the RICOH CloudStream Print&Scan license is required in addition to the Device Management license.
|
Print Usage Analysis Report Templates |
Description |
|---|---|
|
1 Side Usage by Department |
Use this report to view the one-sided print usage of the selected cost centers. Departments with no output are not shown. The one-sided print usage by department is indicated in a bar graph, and department names, number of pages, one-sided print usage (%), and cost are indicated in a table.
|
|
1 Side Usage by User |
Use this report to view the one-sided print usage for the selected users. Users with no output are not shown. The one-sided print usage by user is indicated in a bar graph, and user names, number of pages, one-sided print usage (%), and cost are indicated in a table.
|
|
Color Usage by Department |
Use this report to view the color usage for the selected departments. Departments with no output are not shown. The color usage by department is indicated in a bar graph, and department names, number of pages, color ratio (%), and cost are indicated in a table.
|
|
Color Usage by User |
Use this report to view the color usage for the selected users. Users with no output are not shown. The color usage by user is indicated in a bar graph, and user names, number of pages, color ratio (%), and cost are indicated in a table.
|

Savings (%) is the ratio of cost savings by using black-and-white or two-sided output. The ratio is calculated by the following formula: Savings (%)=(1-(Cost after savings/cost before savings)) × 100
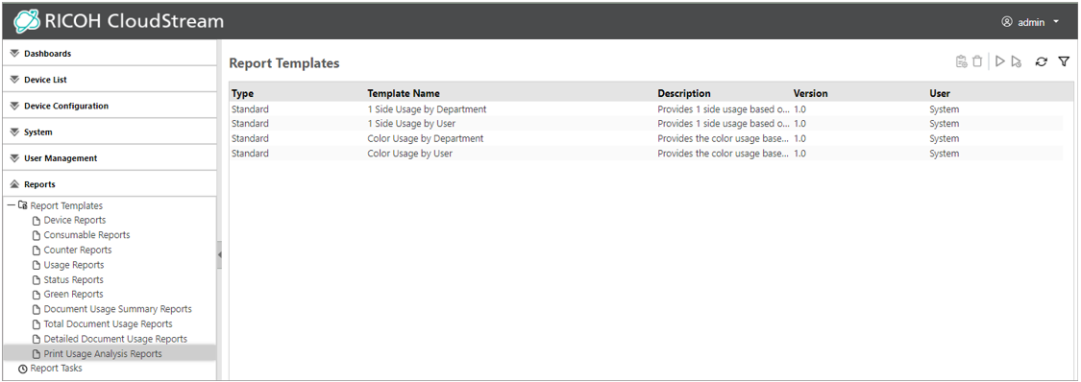
Print Usage Analysis Reports are displayed like the image below: