Device Status
The Device Status dashboard shows the current status of the devices. The graph shows the percentages of devices that are in error, in warning state, and normal.
An example below is how Device Status is displayed in the dashboard.
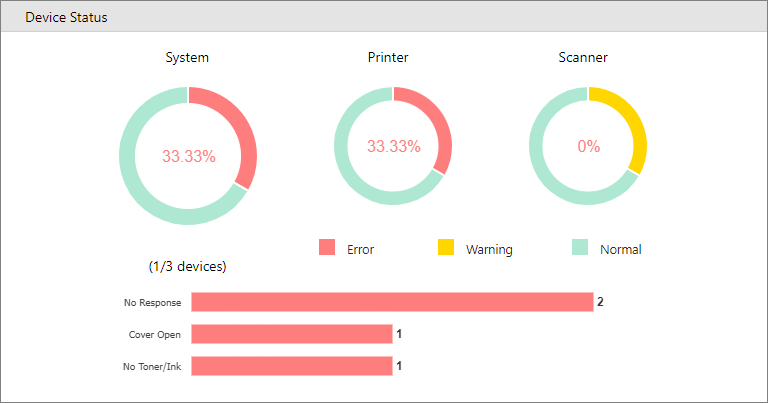
The horizontal bar graphs show the types of error status the devices are experiencing. At the end of the bar, you can find the total number of devices in such a state.
Click a part of the graph to open the Device Status window to show the devices in the same state.
For example, if you click the green portion of the Printer status, you will see a similar screen pop-up.
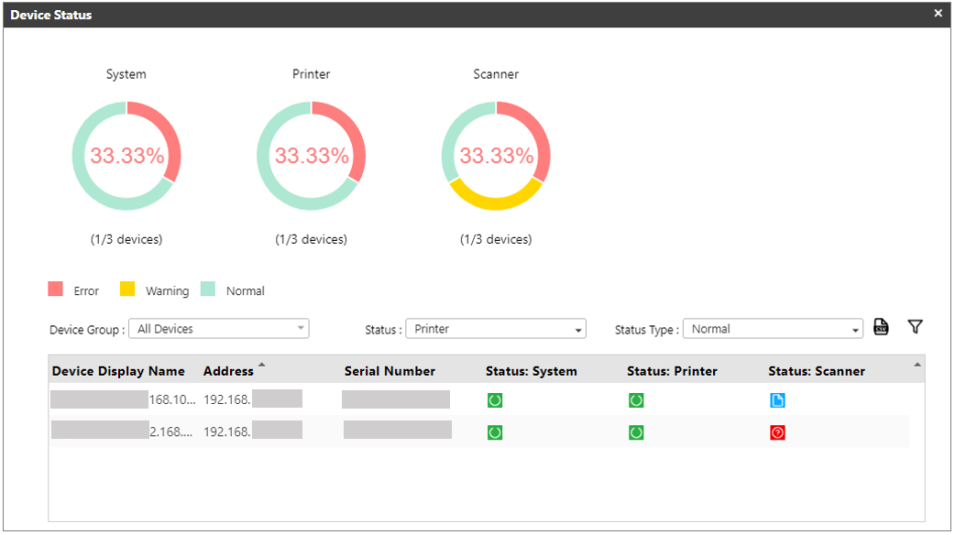
On the above screen, you can see all the devices whose Printer status is normal.
The Device Status detailed screen also has the following functions you can use.
|
Item |
Description |
|---|---|
|
Device Group |
Select a group in the dropdown to display the devices within that group. |
|
Status |
Select a status you want to filter. Options are Printer, System, and Scanner. |
|
Status Type |
Select the type of status you want to see. Options are Error, Warning, and Normal. |
|
Export from CSV |
Click this icon to export the list in the table into a CSV file. |
|
Filter |
Click this icon to filter the device in the table. |
|
X |
Closes the Device Status details screen. |