Connection Status
The Connection Status dashboard shows the device's connection record.
-
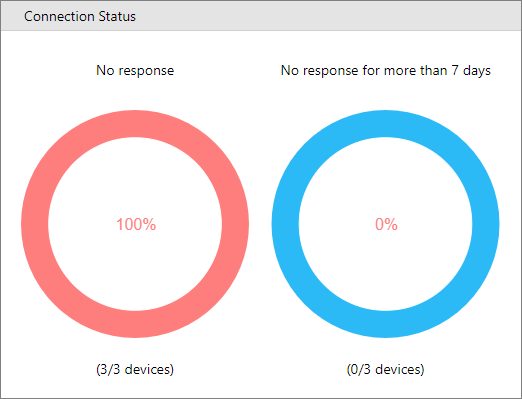
The first donut chart (No response) shows the data of devices that have no response today.
-
The second donut chart (No response for more than 7 days) shows the data of devices that had no response more than seven days from today.
An example below is how a Connection Status is displayed in the dashboard.
When clicking the RED section of the charts, a full layout will be displayed, filtered by the selected value.
When clicking the BLUE section, no action will be taken.
For example, if you click the RED portion of the Connection status, you will see a similar screen pop-up.
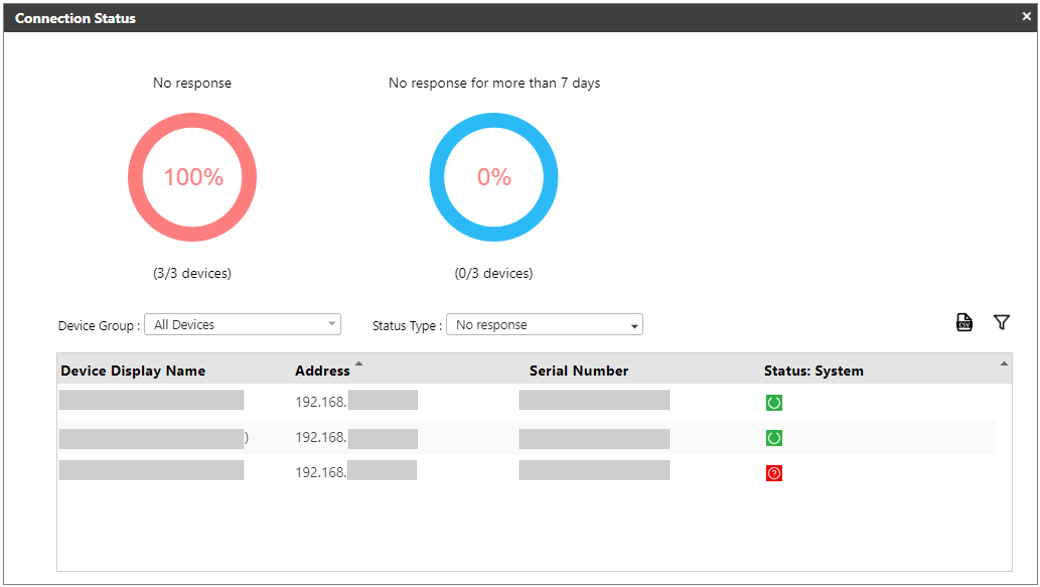
From the above screen, you can see all the devices that are unresponsive to the current day.
The Connection Status detailed screen also has the following functions you can use.
|
Item |
Description |
|---|---|
|
Device Group |
Select a group in the dropdown to display the devices within that group. |
|
Status Type |
Select the type of status you want to see. Options are No response, No response for more than seven days. |
|
Export from CSV |
Click this icon to export the list in the table into a CSV file. |
|
Filter |
Click this icon to filter the device in the table. |
|
X |
Closes the Connection Status details screen. |